Stats Pipeline
Summary
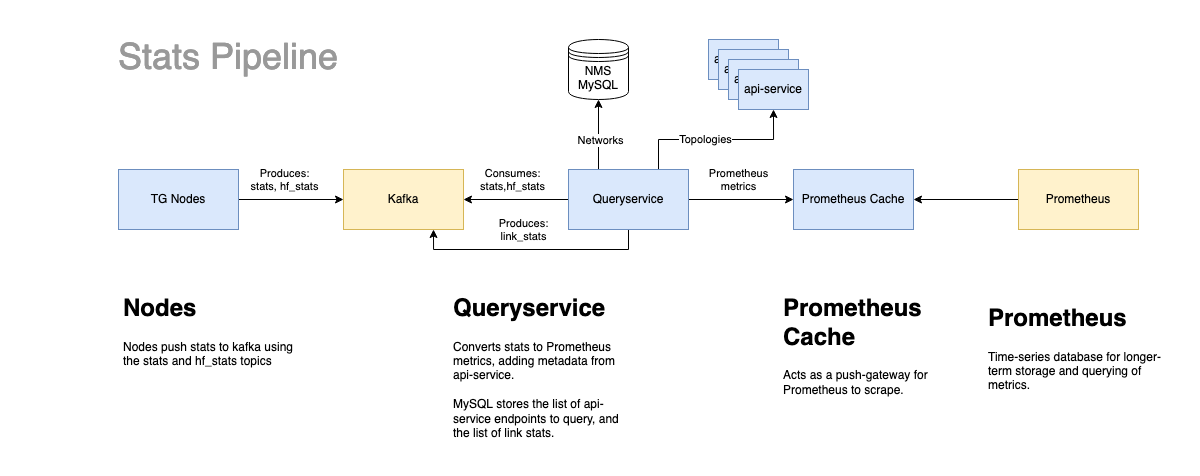
The high-level flow is:
Nodes → Kafka ← Query Service → Prometheus Cache ← Prometheus
Nodes
Nodes push stats to Kafka using the stats and hf_stats topics. Traffic is routed through the POP to the VMs hosting the Kafka services.
Node to Kafka communication can be configured through a number of methods. In both cases, the external IP/Port of the Kafka VM must be used.
Using the NMS
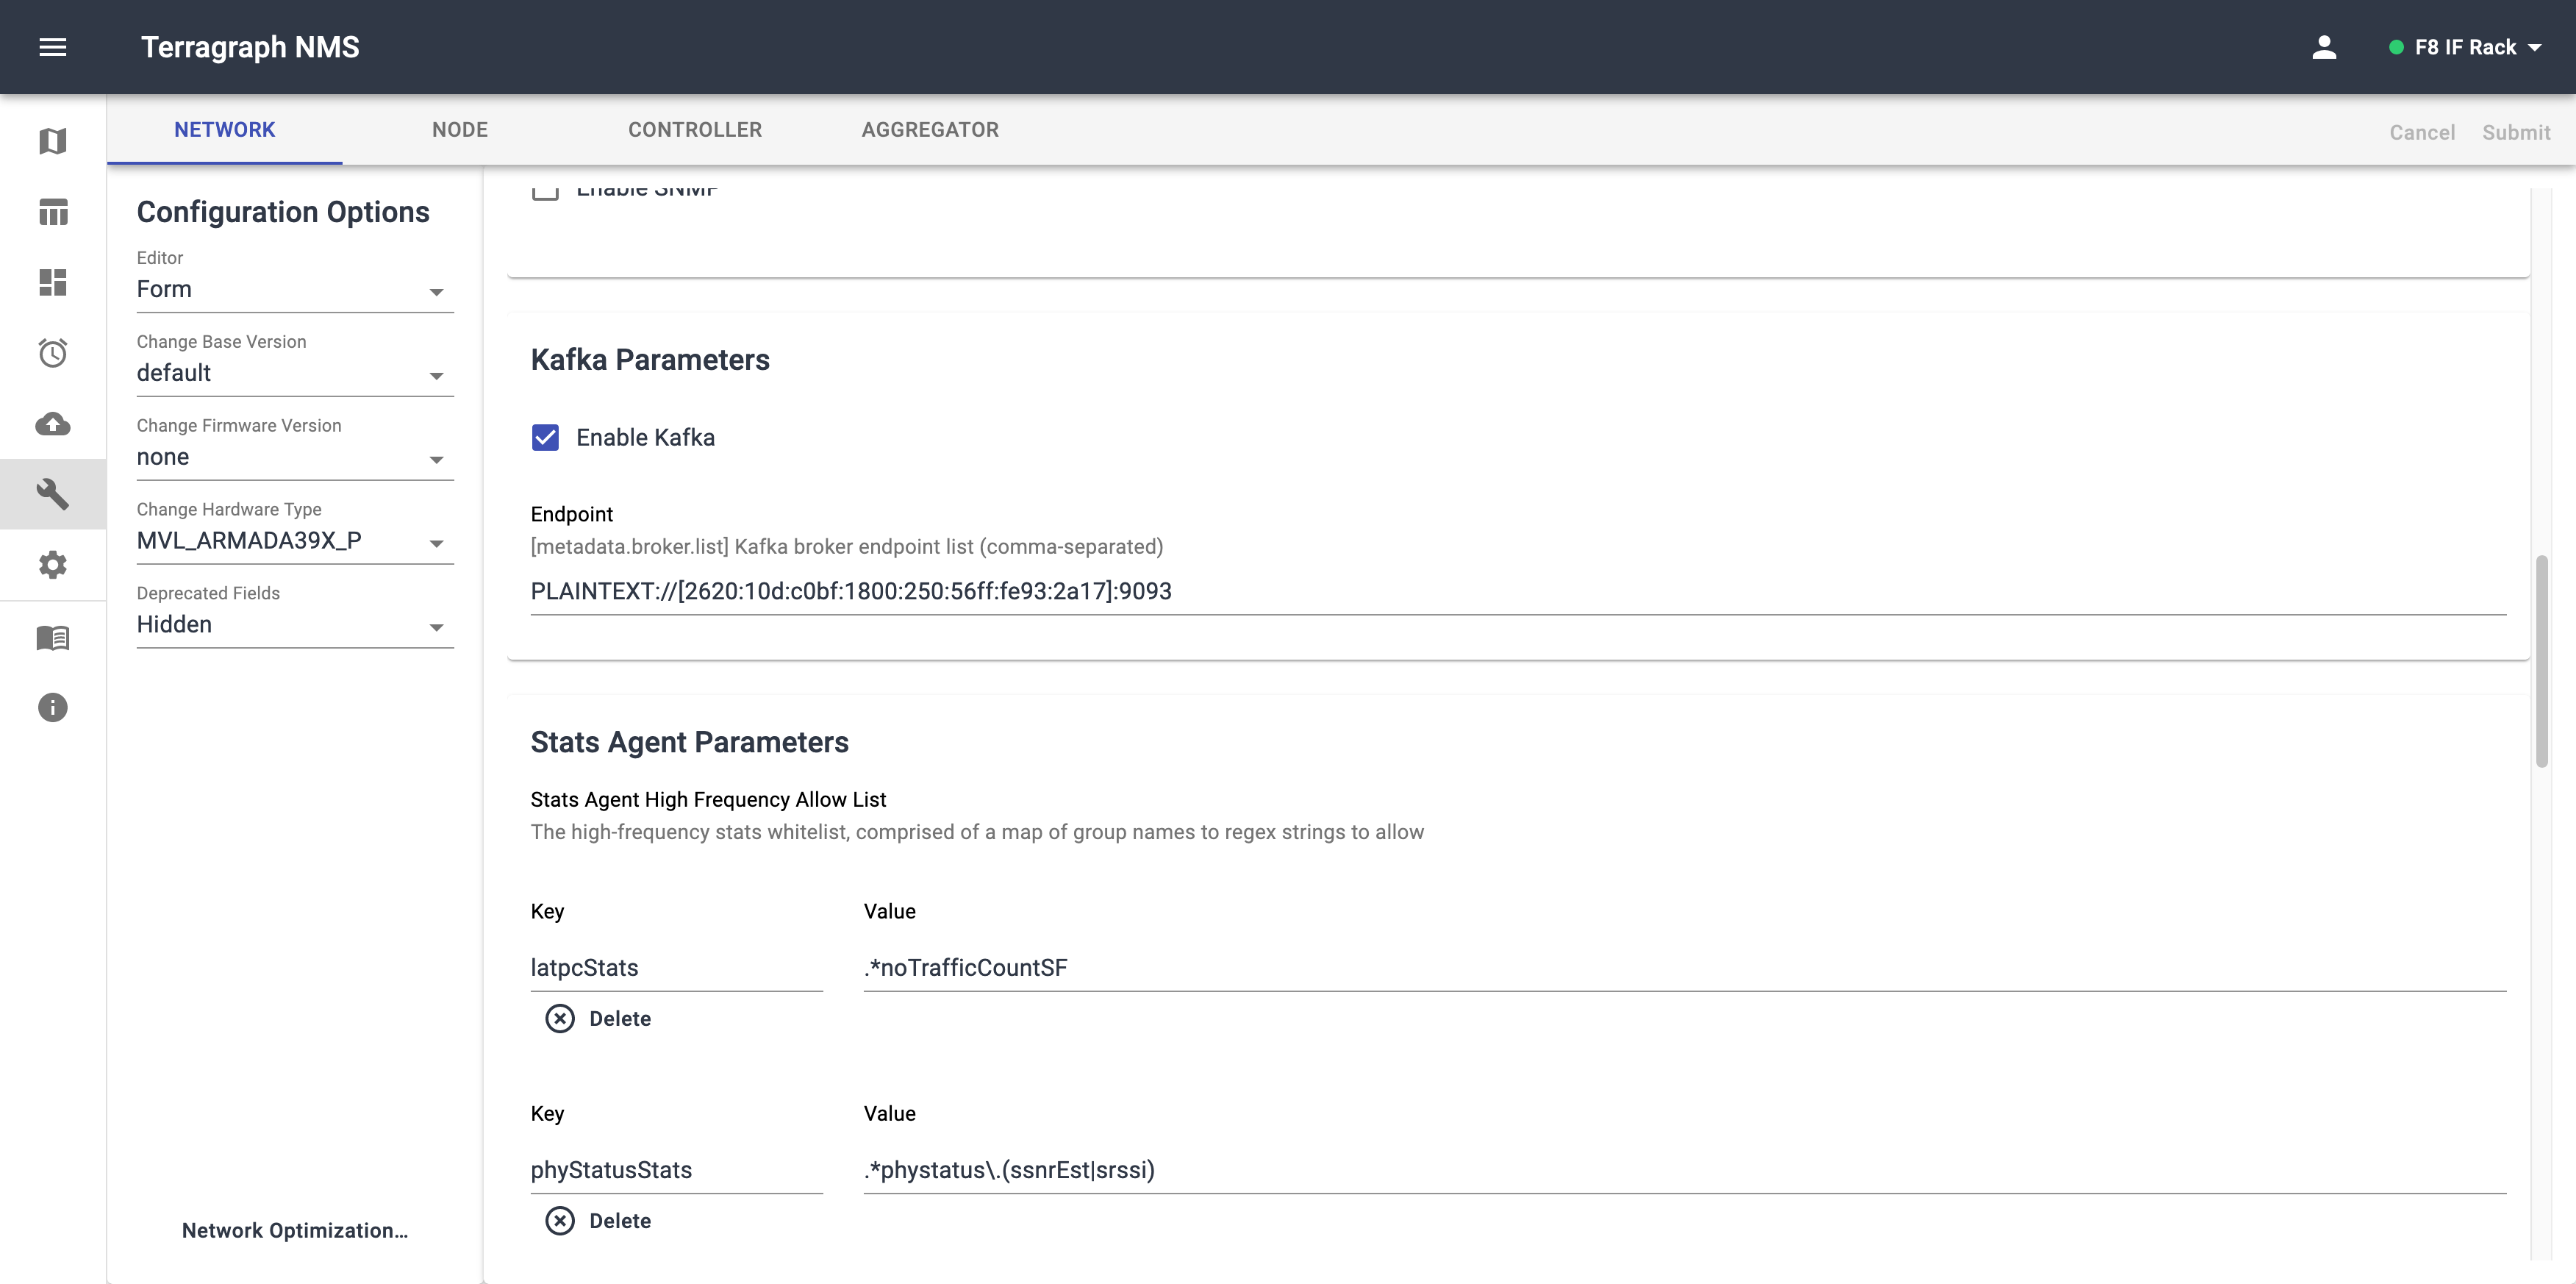
Manually on the node through statsAgentParams in node_config.json:
{
    "statsAgentParams": {
        "endpointParams": {
            "kafkaParams": {
                "config": {
                    "brokerEndpointList": "PLAINTEXT://[2620:10d:c0bf::2000]:9093",
                }
            }
        }
    }
}
Kafka
Kafka is used as a durable queue for stats. This is to ensure that no stats are dropped or processed more than once.
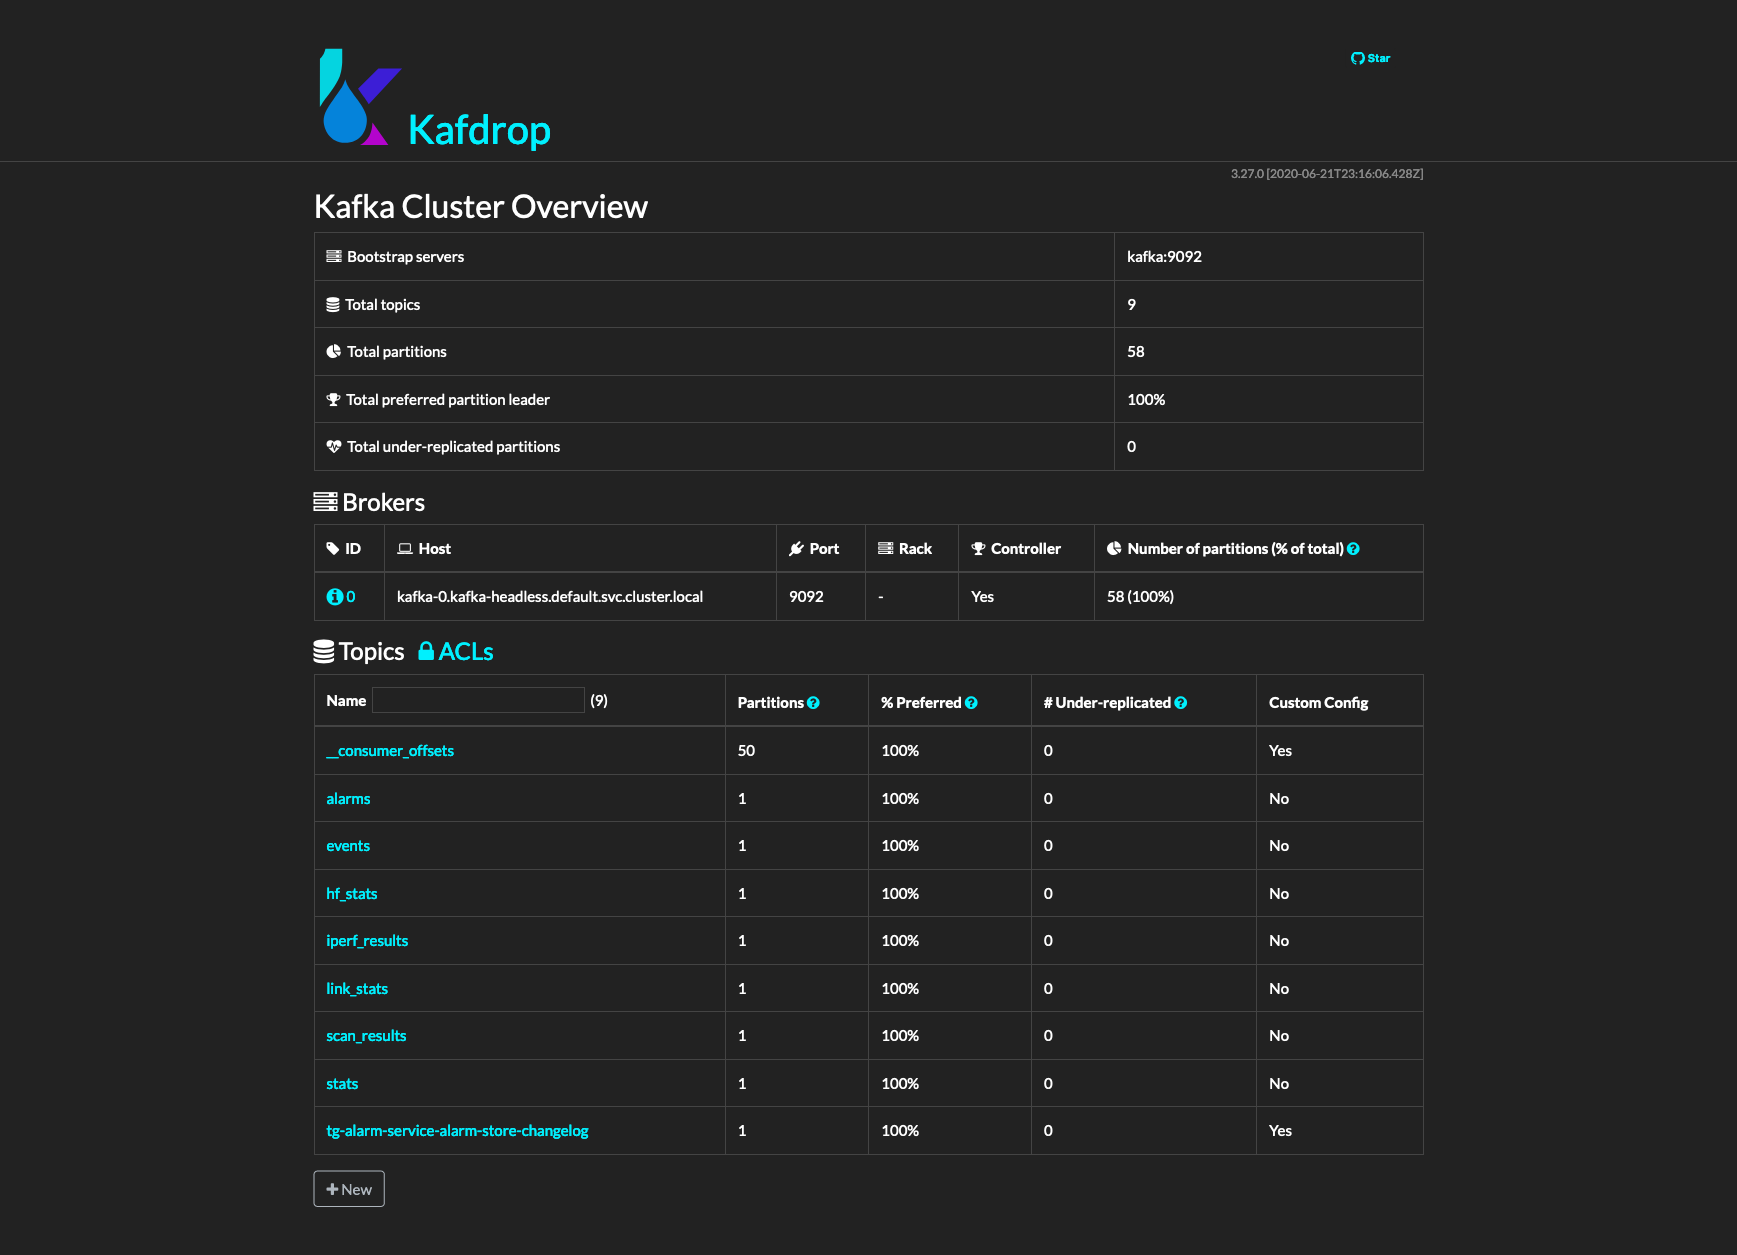
A Kafka UI is hosted within the cluster at /kafdrop. This screenshot shows the default set of topics.
The main topics relevant to the stats pipeline are:
- stats:
Low-frequency stats which are sent by nodes every 30s by default
- hf_stats:
High-frequency stats which are sent by nodes every 1s by default
- link_stats:
Link-specific stats forwarded from stats topic by Query Service for calculating link health.
Query Service
Query Service consumes node stats from Kafka and converts them to Prometheus metrics. It adds additional metadata using the Topologies configured in NMS before forwarding them to the Prometheus-Cache.
Query Service runs in a loop with 2 primary tasks:
Cache all of the topologies specified in MySQL by querying API-Service
Transform AggrStats from Kafka into Prometheus metrics, adding metadata using the corresponding topology of the node referenced in the stat.
Query Service reads node stats from the stats and hf_stats Kafka topics and first forwards link-metric stats onto the link_stats topic. The list of link-specific stats is determined by comparing the key to a set of metric names stored in the link_metric table of the cxl database.
Next, it formats the stats as prometheus metrics.
When the stats come from the nodes, they are formatted as:
# Aggregator.thrift::AggrStat
{
 "key": "tgf.04:ce:14:fe:a5:3b.staPkt.rxOk",
 "timestamp": 1617215039,
 "value": 6442,
 "isCounter": false,
 "entity": "04:ce:14:fe:a5:7a"
}
Query Service uses the mac address stored in the “entity” field to lookup the corresponding node in the NMS’s topology. Next, it creates a prometheus metric with the following format:
metric_name{network="", ...} value
The labels present on all metrics:
network - Name of the topology
nodeMac - MAC address of the node
radioMac - MAC address of the radio sector on the node
nodeName - Name of the node, stored in the topology
pop - Boolean value if the node is a POP node
siteName - Name of the site the node is at, stored in the topology
intervalSec - The interval at which the stats were pushed to Kafka
The following labels are added if the metric is a link metric:
linkName - Name of the link, stored in the topology
linkDirection - A or Z. Distinguishes which of the two sides of the link this metric originated from.
The metric is then pushed to the Prometheus Cache.
Prometheus Cache
Since Prometheus utilizes a pull model, stats are pushed to the Prometheus Cache to then be scraped by prometheus.
Prometheus
Prometheus is the time-series database which powers the TGNMS UI, Grafana, and various other services. The basic Prometheus GUI can be accessed at /prometheus.
Troubleshooting
This section will contain a series of troubleshooting steps. The main user-visible problem will be lack of MCS/SNR overlays in the NMS. This can be further confirmed by querying for the mcs stat in Prometheus.
Bash functions to shorten the commands:
# Swarm only: Lookup the local docker container ID for a swarm service
function·svcname()·{·docker·ps·--format·'{{.Names}}'·--filter·"label=com.docker.swarm.service.name=$1";}
Nodes Troubleshooting
Important Log files:
/var/log/stats_agent/current
/var/log/e2e_minion/current
Check if the node can ping the E2E VM:
ping6 2620:10d:c0bf::2000
Check if there is a route through the POP:
# VPP routing
vppctl show ip6 fib

# Kernel routing
ip -6 route show
Check if the node has Kafka configured correctly:
cat /data/cfg/node_config.json | grep broker
Check if the node has an IP6 address on the loopback interface:
ip -6 address show dev lo
Check if the E2E IP/Port combo is correct:
cat /data/cfg/node_config.json | grep e2e-ctrl-url
Kafka Troubleshooting
Check if messages are coming through on the stats or hf_stats topics:
# K8s
kubectl exec statefulset/kafka -- kafka-console-consumer.sh --bootstrap-server 127.0.0.1:9092 --topic hf_stats
# Swarm
docker exec -it $(svcname kafka_kafka) kafka-console-consumer.sh --bootstrap-server 127.0.0.1:9092 --topic hf_stats
Check if there are any consumer groups for stats/hf_stats topics:
# K8s
kubectl exec statefulset/kafka -- kafka-consumer-groups.sh --bootstrap-server 127.0.0.1:9092 --all-groups --all-topics --describe
# Swarm
docker exec -it $(svcname kafka_kafka) kafka-consumer-groups.sh --bootstrap-server 127.0.0.1:9092 --all-groups --all-topics --describe
An healthy example of consumer groups:
GROUP           TOPIC           PARTITION  CURRENT-OFFSET  LOG-END-OFFSET  LAG             CONSUMER-ID                                  HOST                               CLIENT-ID
health_service  link_stats      0          15335760        15335984        224             rdkafka-... /fd00::fb33 rdkafka

GROUP                TOPIC           PARTITION  CURRENT-OFFSET  LOG-END-OFFSET  LAG             CONSUMER-ID                                  HOST                               CLIENT-ID
qs_node_stats_reader stats           0          22770478        22770478        0               rdkafka-... /fd00::fb33 rdkafka
qs_node_stats_reader hf_stats        0          14910508        14910508        0               rdkafka-... /fd00::fb33 rdkafka

GROUP            TOPIC           PARTITION  CURRENT-OFFSET  LOG-END-OFFSET  LAG             CONSUMER-ID                                                                                                        HOST                              CLIENT-ID
tg-alarm-service events          0          6681            6681            0               tg-alarm-service-... /fd00:cdee:0:0:fd43:e24:a84c:2b1a tg-alarm-service-...
Check if Kafka is binding properly:
# An example of the K8s pod's environment variables
- name: KAFKA_ADVERTISED_LISTENERS
  value: "INSIDE://:9092,OUTSIDE://[2620:10d:c0bf::2000]:9093"
- name: KAFKA_LISTENERS
  value: "INSIDE://:9092,OUTSIDE://:9093"
Download the Kafka debugging tools, following the instructions on https://kafka.apache.org/documentation and then try to consume the Kafka topics from outside the Swarm/K8s cluster. This will tell you if Kafka is binding properly externally.
Check if Zookeeper is healthy:
# K8s
kubectl logs -f statefulset/zookeeper
Check if Kafka is exposed properly:
# K8s
kubectl logs -f daemonset/nginx
kubectl get configmap/stream-conf | grep kafka

# Swarm
docker service inspect kafka_kafka | grep -i port
Query Service Troubleshooting
Check if Query Service can reach api-service:
# K8s
kubectl logs deploys/queryservice | grep CurlUtil

# Example error
CurlUtil.cpp:74] CURL request failed for http://e2e-test-network:8080/api/getTopology: Timeout was reached
Check the topology file in api-service:
# K8s or Swarm
cat /opt/terragraph/gfs/e2e/test-network/e2e_topology.conf
Does it have a “name”? Are there links, nodes, and sites?
Prometheus Troubleshooting
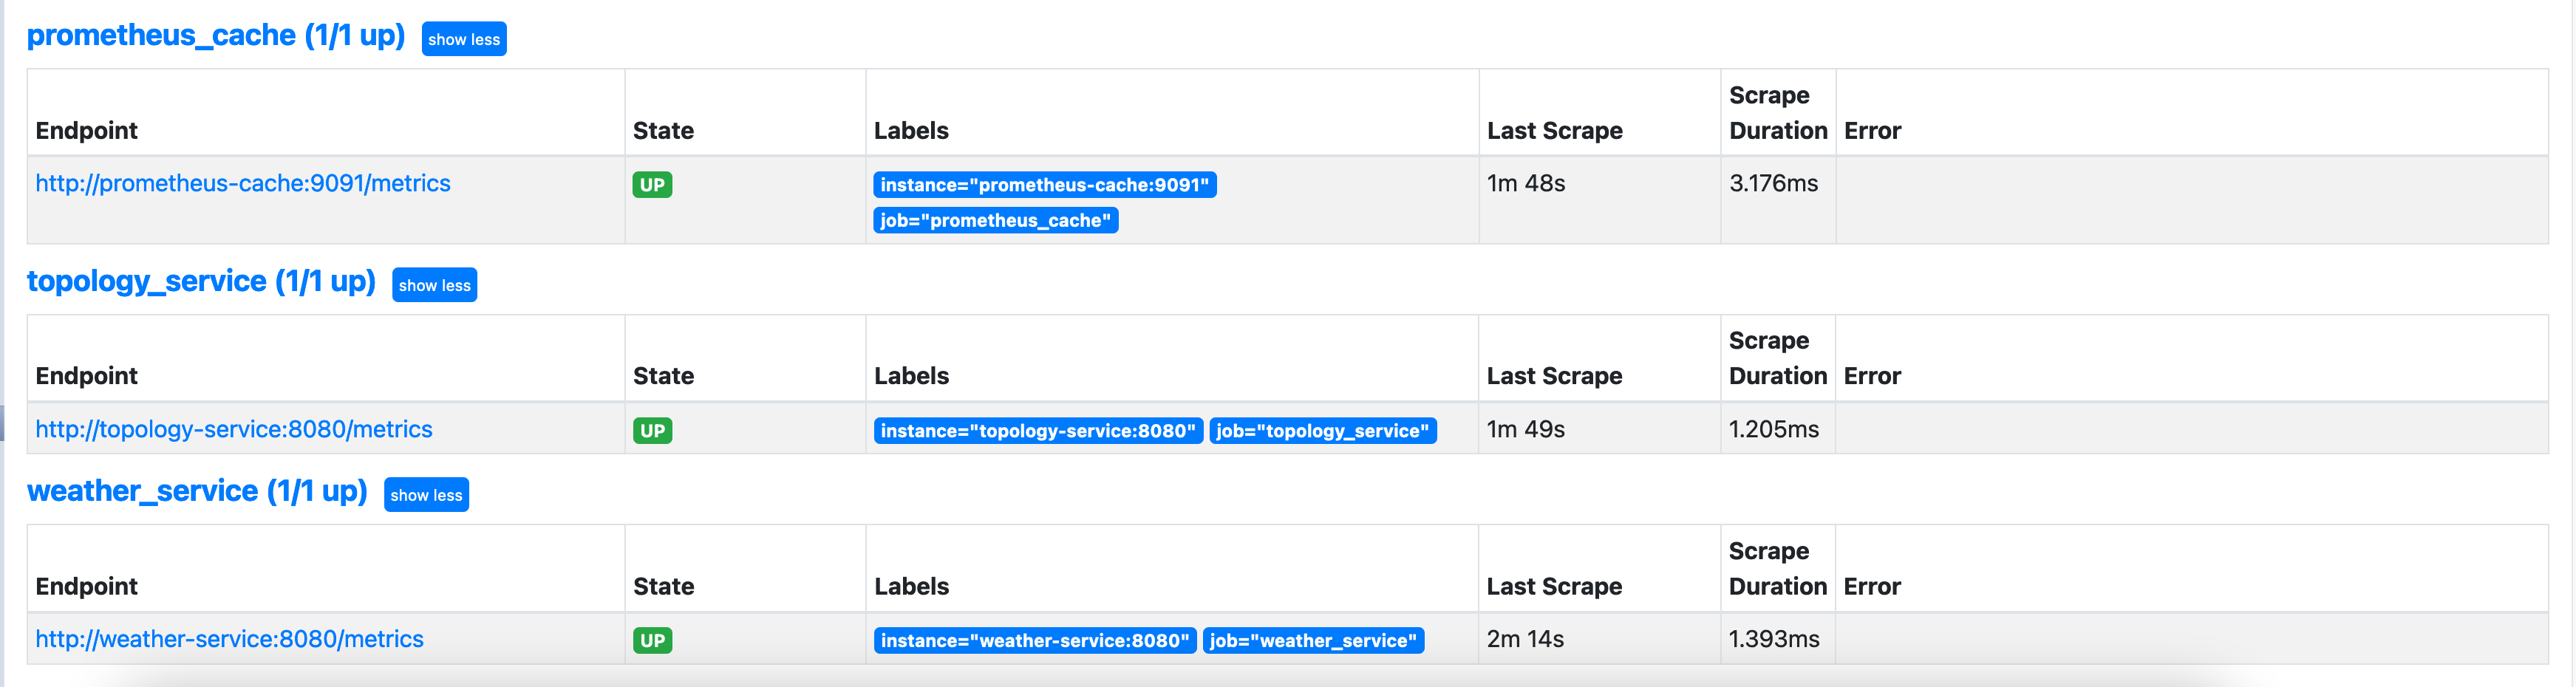
Check if the scrape targets are up by viewing /prometheus/targets in the browser: